Visualisation and Analysis of Large and Complex Networks (VALACON)
|
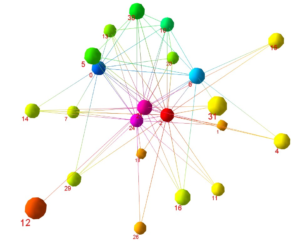
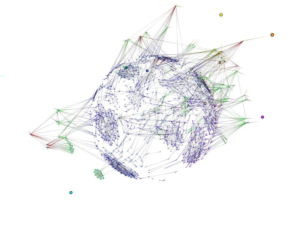
Visualisation and Analysis of Directed Graphs in 3D (Hong/Nikolov) This is an example of a network of the e-mail communication in an office over a four month period. Each node represents a person and each edge represents at least one e-mail exchanged between two people. The color of the nodes is related to their degree centrality.
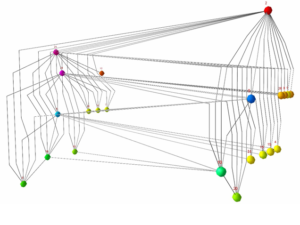
The 3D drawing convention that we study consists of splitting the graph into too parts and drawing each of them as a 2D hierarchy in a plane. The two planes are parallel. We can make the hierarchy easier to comprehend by imposing direction on the edges from the node with a higher degree centrality to the node with a lower degree centrality. The color of the nodes is loosely related to their position in the We can combine the visual representation of the degree centrality with a visual representation of the eigenvector centrality by the size of the nodes.
Alternatively, we can split the hierarchy in more than two parallel planes placing each node at the barycenter of its neighbors on the level below it. These methods are implemented as a part of GEOMI, a visual analytic tool being developed by the VALACON project.
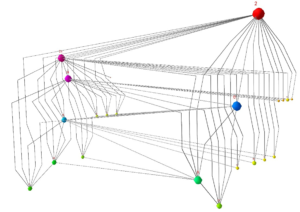
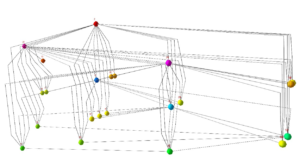
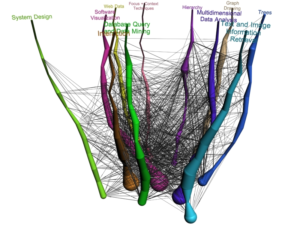
Visual Analysis of Network Centralities (Hong/Xu) Centrality is the most significant concept for such networks; it identifies the mostimportant node in the network. For example, in biological networks such as protein-protein interaction networks, one can identify the most essential protein. In social networks such as the Hollywood movie actor collaboration network, one can identify the most prominent actor. A particularly important task is the comparison of different centrality measures within one network. We design three new methods for the exploration and comparison of centrality measures within a network: 3D parallel coordinates: nodes are placed on vertical lines Orbit-based comparison: nodes are placed on concentric circles Hierarchy-based comparison: nodes are placed on horizontal lines For each centrality measure, the graph is copied and drawn on a separate 2D plane with node position dependent on centrality. These planes are then stacked into the third dimension so that the different centrality measures may be easily compared.
[Hierarchy-Based Comparison: Biological Network] These methods are implemented as a part of GEOMI, a visual analytic tool being developed by the VALACON
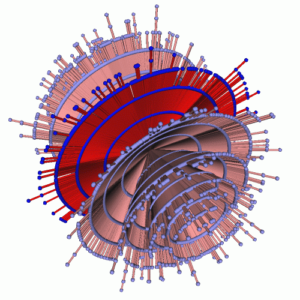
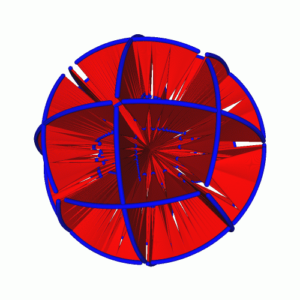
Visualisation of Large and Complex Scale-free Networks (Ahmed, Dwyer, Hong, Murray, Song, Wu) Scale-free networks appear in many application domains such as social networks and biological networks. We designed new visualisation methods of scale-free networks in 3D. To make effective use of the third dimension with minimum occlusion, we use the concept of layered drawings and concentric spheres, constraining nodes to lie on parallel planes or the surface of spheres, based on the degree of nodes. Experimental results with real world data sets show that our method can be useful for visual analysis of large and complex scale-free networks.
[Evolution of research area in InfoVis community] [Prominent researchers in InfoVis community]
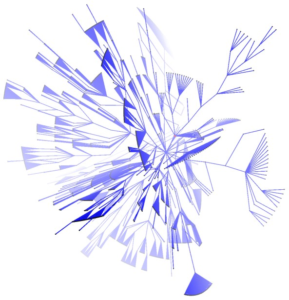
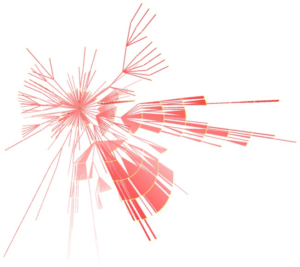
Visualisation of Large and Complex Networks Using POLYPLANE (Hong) POLYPLANE is a new method for visualisation of large and complex networks in 3D. In particular, it focuses on visualising the core tree structure of the large and complex network. The algorithm uses the concept of subplanes, where a set of subtrees is laid out. The subplanes are defined using regular polytopes for easy navigation and minimum occlusion. The algorithm can be implemented to run in linear time. The experimental results with real world networks show that it produces nice layouts of large trees with up to ten thousand nodes.
[Hollywood movie actor collaboration network(Kevin Bacon Number)] [Mathematician collaboration network (Erdos Number)] |