|
GEOMI-2 |
||||||
|
Introduction |
||||||
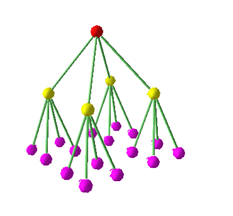
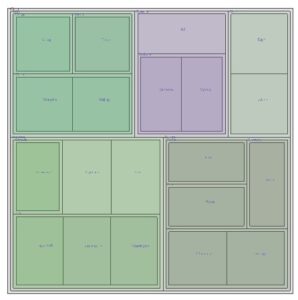
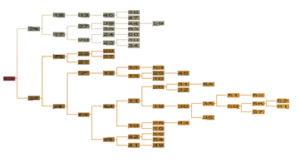
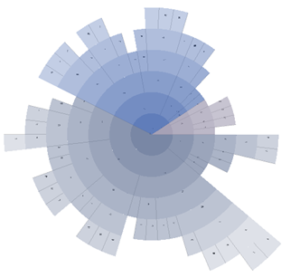
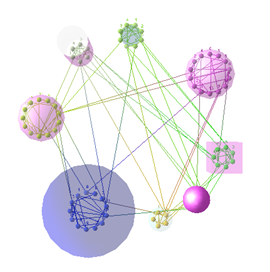
| GEOMI (Geometry for Maximum Insight) is a visual analytic framework for the visualisation and analysis of large and complex networks such as social networks and biological networks in 3D. The framework was developed by NICTA and University of Sydney, Australia.
GEOMI provides cutting edge visual analytic tools combining network visualisation techniques with network analysis methods to enable exploring and discovering such networks for critical insights. A new version of GEOMI, namely GEOMI-2, provides a large number of novel tools for visual analysis of large networks. The new version gives more tools for visual explorations and interactions of such networks for patterns and trends in three dimensions. Some provided tools are very domain specific such as for bio-networks and social networks. The new framework has been developed at University of Sydney, Australia. See GEOMI-2.0 for project details and download the project. See GEOMI-1.0 for the previous version of GEOMI. See SBI GEOMI for the SBI version of GEOMI. For more information about information visualization researh in the University of Sydney, please visit INFOVIS GROUP . |
||||||
|
User Guide |
||||||
|
||||||
|
||||||
|
||||||
|
||||||
|
||||||
|